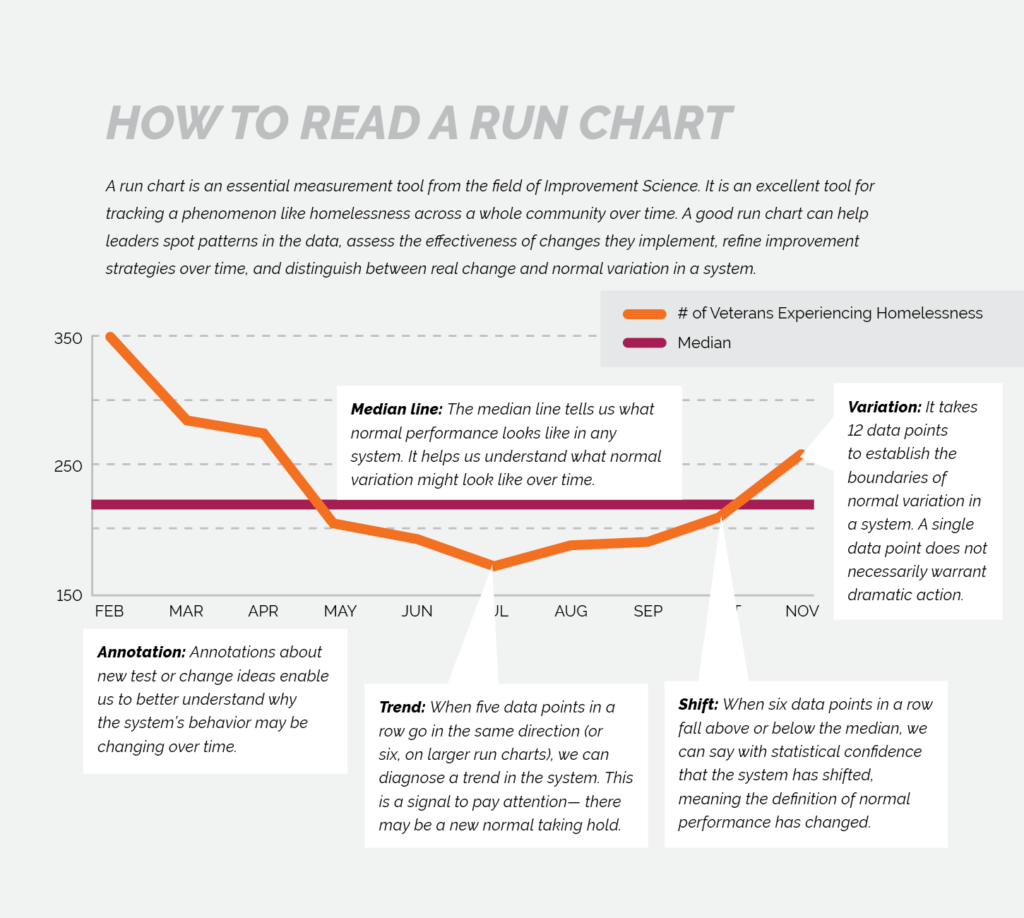
Run Charts
Definition: A run chart is an essential measurement tool from the field of Improvement Science, used to track a phenomenon like homelessness across a whole community over time.
How it is used: Thanks to Built for Zero’s partnership with Tableau, communities can visualize their by-name list data in what is known as a run chart. Run charts allow communities and leaders to understand whether investments and changes to the system are actually reducing the number of people experiencing homelessness in their community. Run charts also allow communities to spot patterns in the data and distinguish between real change and normal variation that occurs in a constantly changing system.
Shifts
Definition: As communities work to reduce the number of people experiencing homelessness, they measure progress by changes known as shifts. A shift means that a community has driven the number of people experiencing homelessness below their median for six consecutive months. When six data points in a row fall above or below the median, we can say with statistical confidence that the number of people the homeless system regularly sees each month has shifted, meaning the number of people experiencing homelessness on a normal day has changed.
Why it is important:
- A shift means that a community has made a measurable, meaningful reduction in homelessness and a major improvement in their system.
- A shift tells us when there has been a fundamental, sustained change in the median level at which the system operates. When the median changes, it tells us that we can expect to see fewer people experiencing homelessness in the community.
- As communities see more consecutive numbers below the median, the percent chance that the number got there randomly drops. At six points below the median, it is .0125% likely that the numbers are there by chance. At such a low likelihood, we can be confident that something in the system has fundamentally changed and caused true improvement.
Medians
Definition: Mathematically speaking, the median is the middle number in a group of numbers. In the run chart used by Built for Zero communities, the median represents the baseline state of the system, meaning that if the system continued operating without changes, it would likely continue to report more-or-less the median number of people.
How is it established: Communities report data on the number of people experiencing homelessness in their area every month. After six months of reporting, the Built for Zero team calculates the median to set the baseline. When we talk about a shift, we’re talking about a decrease in the median level at which a system performs. We can tell that a shift has occurred by looking for six consecutive data points below the community’s baseline median.
Articles & Videos
- Detroit Achieves 33% reduction in veteran homelessness in 2020
- What is a shift, a by-name list, and what do they have to do with ending homelessness?
- Minneapolis/Hennepin County achieves 30% reductions in chronic homelessness by improving their system
- A Way Home Washington Anchor Community of Spokane achieves a 20% reductions in youth and young adult homelessness
- Video: See Built for Zero’s Data Dashboards