Purpose: A guide to help communities identify key data points for inflow analysis and tips on how to analyze this data to understand system areas of focus for inflow reduction goals.
The Challenge
Communities cannot reliably reach and sustain an end to homelessness if inflow into homelessness consistently exceeds outflow out of the system. Reducing inflow is a critical strategy for most communities to accelerate their trajectory towards ending homelessness. Quantitative analysis of de-identified HMIS/BNL datasets from the most recent 3- 6 months of inflow can help provide insights into inflow into a community’s homelessness system to identify themes and pathways into homelessness. This is a solid starting point to identify strategies to reduce inflow into homelessness. While quantitative data analysis can provide important insights, it is important to pair it with qualitative information from people with lived experience of homelessness to add context and deepen understanding of the challenges faced on the pathway to homelessness.
Guidelines
Quantitative Analysis Guidelines
- Be sure to deduplicate your dataset before you de-identify it
- De-identify your dataset, removing the following fields:
- Client ID
- Client Name (first and last)
- Client Social Security Number
- Client Date of Birth (Please include client age or client year of birth instead)
- Datasets should include historical data for your determined look-back period. This lookback period ideally should be as far back as your dataset can provide to allow for more comprehensive historical information on client interactions with the system.
- Be sure to include the date of identification when the client first entered your system of care
- Plan to conduct a limited “test analysis” first with a smaller dataset to assess the viability and usefulness of this approach. Suggest doing this for the most recent month of inflow or the most recent 3-6 months, depending on the size of the community (e.g., a small dataset between 25 and 100 records). For the initial analysis, identify 5-10 data elements that you perceive to have strong completeness and accuracy.
Data Completeness Considerations
Before completing a quantitative data analysis, communities should have comprehensive, accurate, and up-to-date information on every person experiencing homelessness, including their homeless history. If the priority data fields that you hope to use in your analysis are incomplete or inaccurate for less than 75% of clients inflowing into your HMIS, it is recommended to pause analysis and work on data completion. The work that you do to improve data entry and completeness will provide you with additional insights critical to understanding the true nature and dynamics of your inflow and prevent you from drawing false conclusions. This work may also provide insights into whether there are patterns in the missing data, such as disparities in higher rates of missing data for certain demographic groups.
Engaging People with Lived Experience of Homelessness (PWLEH)
Engaging People with Lived Experience of Homelessness to participate in both quantitative and qualitative analysis is necessary to develop relevant and responsive system implementations, based on insights from people who have had the experience of coming into a homelessness response system. This approach ensures that invaluable knowledge and direct experience are included in efforts to analyze data, provide context, eliminate data bias, and develop solutions.
If your community already has a PWLEH council, you may consider asking that council if there is capacity for integration in your quantitative and qualitative inflow analysis efforts. In the absence of a PWLEH or if there is no capacity, we encourage communities to engage PWLEH in their inflow analysis workgroup as a best practice. It is important to ensure meaningful engagement, including compensation and full inclusion from the outset of your inflow analysis project.
More information on recruiting and engaging People with Lived Experience can be found here.
Quantitative Inflow Analysis
There are two components of a quantitative inflow analysis using HMIS data. The first is using information from your community Performance Management Tracker (PMT) to glean initial insights into focus areas of inflow. The second is a deeper dive using various HMIS data elements to explore further into the focus areas identified through the PMT.
PMT Analysis for High-Level Insights
There are four data points that can be pulled from the PMT that can provide insight into the inflow into the system:
- Total Inflow: The total number of clients entering the system
- New Inflow: The number of clients coming into the system for the first time
- Returned from Housed: The number of clients who were previously housed by the system and are returning as homeless
- Returned from Inactive: The number of clients who were previously moved off the By-Name-List to inactive and are returning as homeless
By looking at these data points over a determined time period, it is possible to identify where to focus a deeper dive. For example, a PMT analysis may show your community has a large number of people returning from housing, and this is where you want to dive deeper to understand what is happening to cause that.
EXAMPLE:
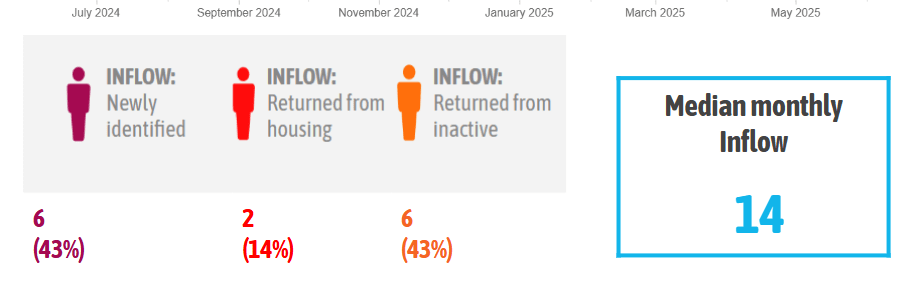
This is an example of a PMT inflow analysis for a community that wanted to determine how to decrease inflow into their system. By looking at their 12-month averages, they could identify initial patterns to explore further. In this case, the community identified that most of their inflow came equally from people coming back to the system from inactive and people who were new to homelessness for the first time. Their returns from housing were low, and this showed the community was good at keeping people housed. As a next step, the community decided to dive further into newly homeless and returning from inactive to identify where they should focus their system improvement projects.
If you need help pulling and analyzing your PMT data, please ask your BFZ coach for assistance!
Deeper Dive
Below is a list of suggested data elements that can be pulled and reviewed as part of a deeper inflow analysis. An analysis of these data elements can provide teams with deeper information about who, why and where from, people are becoming homeless and entering the system. Included is information on what kind of information and insights these data elements can tell us and the potential limitations of this data.
| Data Element | What this can tell us | Limitations |
| Data elements that capture why people become homeless. Examples of data elements you may include: Reason for homelessness for newly identifiedReason for homelessness For returns from housedReason for return from inactivePrior Living situation | Provide insights into the reasons why people are falling into homelessness, such as lack of income, household crisis, domestic abuse. Help target resources upstream, for example in CAP offices, benefits offices, foodbanks, with domestic abuse hotlines | “Reason for homelessness” may not always be answered with an accurate reflection of a client’s circumstance and may change depending on the timing of the assessment. Deeper diving with qualitative analysis, such as case notes and case manager interviews can help identify issues more closely. |
| Data elements that capture the geographic location from which a person entered the system from Examples of data elements you may include: Last permanent zip-code | This can be helpful to identify migration patterns between regions to understand seasonality and where clients may be moving in and out from. This information can assist in coordination with neighboring states/county’s and can inform resource allocation. Zip-code data can also provide insight into which localities may be “high risk”, to enable the targeting of upstream resources. | This information should not be included in an inflow analysis unless it is being accurately and consistently completed. |
| Data elements that capture who is becoming homeless based on demographic information Examples of data elements you may include: Income Type (Income or no Income)Income brackets (AMI) Disabling Condition (Disabling condition or no disabling condition) Disability type Age (By brackets) Race/Ethnicity Gender | Who is inflowing into the system? This can provide insights into who is most of risk of homelessness and where there may be opportunity for cross-sector collaboration to target resources upstream. E.g if there is a high proportion of older adults entering the system, collaboration with the DES or other entities offering older-adult services may help curb inflow from this group of people. | Data accuracy – This type of data is often self-reported or missing and may not always be accurate. Having data quality processes in place to ensure questions are being asked and recorded and efforts are made to verify information where needed will help to reduce accuracy limitations, |
How to read and interpret an inflow analysis
An inflow analysis using HMIS data to get deeper insights into who is inflowing into the system can help communities uncover the patterns in inflow relating to things like who is commonly inflowing into the system, from where, and for what reason. These identified patterns can form areas of focus for system improvement. For example, if an inflow analysis unveils that the most common reason for homelessness for people who are entering homelessness for the first time is “Lack of Income”, this informs the system that economic crisis is a significant contributing factor in the community as to why people experience homelessness. Communities may then explore targeting prevention resources at places like community action agencies, where people may turn to in the first instance of an economic crisis.
It is possible to disaggregate total inflow information by data element to visualize the data point by percentage breakdown, and more easily view and analyze this information.
EXAMPLE:
| Stated Reason for Homelessness for Veterans Newly Homeless | |
| Lack of Income | 24.3% |
| Household Crisis | 21.6% |
| Domestic abuse/violence | 13.5% |
| Medical problems | 10.8% |
| Other | 8.1% |
| Substance/Alcohol Dependency | 8.1% |
| Divorce | 8.1% |
| Eviction | 2.7% |
| No Affordable Housing | 2.7% |
This is an example of an analysis of HMIS data for a community that identified the majority of inflow was coming from veterans who were new to homelessness. To understand this more deeply, they pulled data for “Stated Reason for Homelessness”, which is a data element captured in initial assessments. By breaking down this data element by stated reason as a percentage, it was possible to identify the most common reason for first becoming homeless. This analysis highlighted two clear reasons for homelessness that were most common: “Lack of Income” and “Household Crisis”. The next steps for this community were to do a qualitative dive into “Household Crisis” and what this captures. The community also chose to focus on the percentage of veterans who were stating Domestic abuse/Violence as their primary reason for homelessness, leading to a system improvement project to build relationships with DV and Victim Service Providers.
RESOURCES
Link to example data visuals for reason for homelessness
Link to example data visuals for new inflow demographics
Link to example data visuals for new inflow analysis
If you need help pulling and analyzing your HMIS data, please ask your BFZ coach for assistance!
Qualitative Inflow Analysis
To gain deeper insights into system inflow to add context and story-type information to the quantitative data. A qualitative data analysis can help to add additional context to data points such as “housing crisis” as a reason for homelessness and provide the opportunity to understand patterns identified on a deeper level.
Types of qualitative analysis:
- Implementation of an inflow case conferencing approach to gain a deeper understanding of pathways into homelessness. This can lead to the emergence of potential upstream solutions and partnerships, plus key strategies for homeless prevention, while identifying housing and case management support if the client remains homeless.
- Interviews and focus groups with clients who have lived experience of homelessness
- Reviewing case notes in HMIS with a cross-section of clients
- Interviews with case managers to gain additional insight into patterns identified in a quantitative analysis
Using Inflow Analysis for Action
Information gained from an inflow analysis can help teams to understand the pathways to homelessness and use this information to identify solutions to decrease inflow into the system. This can look like greater collaboration with cross-sector partners to educate around available homeless prevention resources, or targeting resources and support in non-traditional locations such as senior centers, food banks, and benefits offices to meet clients before they become homeless. It is crucial to focus on how your community’s inflow analysis helps clients who have recently entered the system and what projects need to be tested to address homelessness upstream. The HSLC (Housing Stabilization Learning Cohort) Toolbank is a resource to start implementing change ideas into your system to address themes uncovered in the Inflow Analysis.