Choosing the best chart type for your data is instrumental in communicating your findings to audiences. In this session, we started with a walkthrough of Shanna Cherubini’s dashboard analyzing new, returning, and recidivist veteran clients, and then we went through a series of chart sketching exercises to practice choosing the right chart for the data question. Topics covered include:
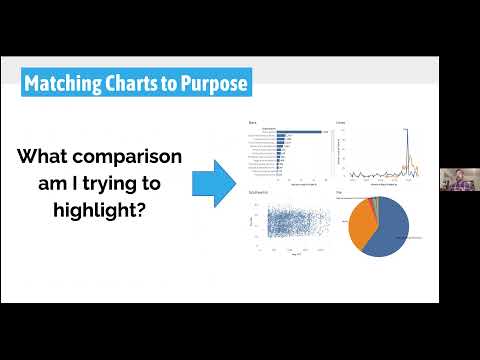
- Matching Charts to Purpose
- Sketching to Iterate
- Why Bar Charts are Often the Best Place to Start!