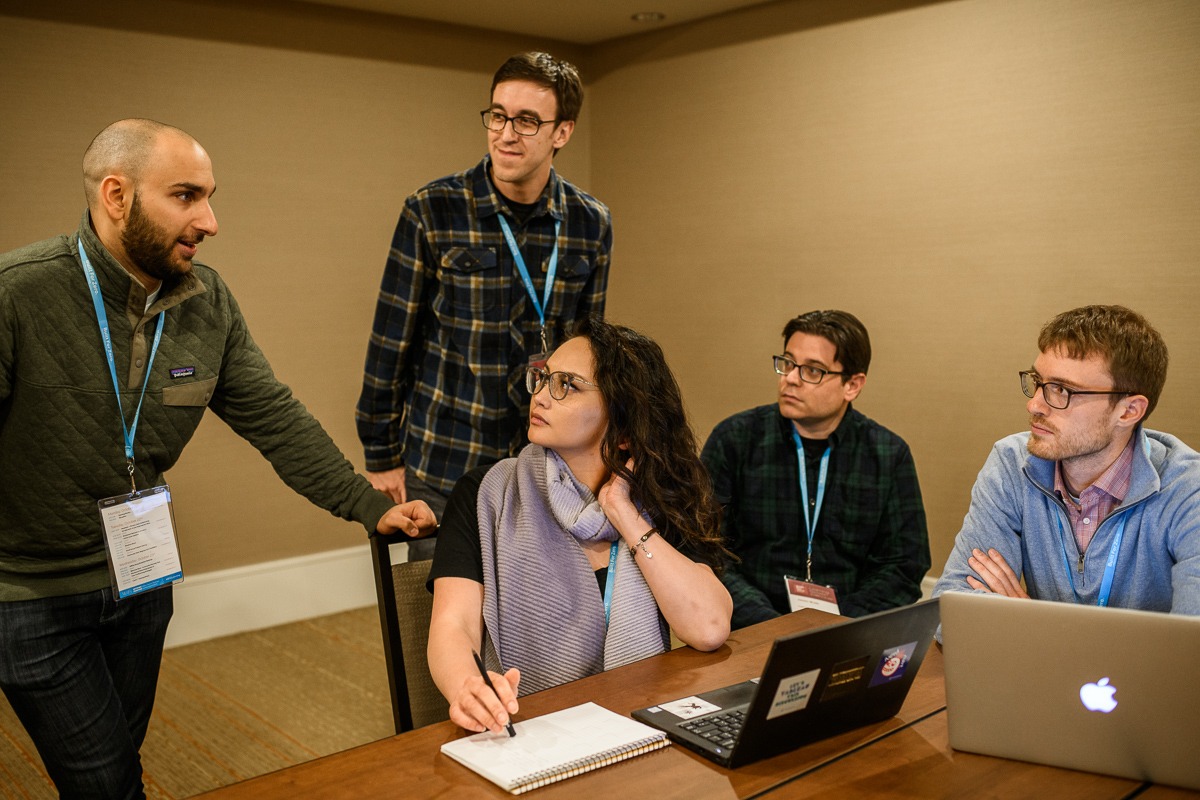
Jason Weill, a Tableau Software Senior Software Engineer, arrived at the Denver Learning Session to embed with the Metro Denver Homeless Initiative (MDHI) team, to learn about the unique characteristics of homelessness data, utilize their expertise to address key challenges, and closely engage with data leaders from other Built for Zero teams.
Weill was joined by his colleagues Frannie Makabenta and Jeremiah Darais of the Tableau Service Corps — a volunteer network of Tableau “experteers” dedicated to helping nonprofits achieve more with their data.
“I love the sentiment that functional zero homelessness is attainable,” Weill said.

— Jeremiah Darais
REAL-TIME, QUALITY DATA DRIVES SYSTEMS IMPROVEMENT
How do we achieve measurable results to solve something as complex and dynamic as homelessness?
Data is a critical tool, allowing Built for Zero communities to fight homelessness at the systems level. Real-time, quality data enables local leaders to track each person experiencing homelessness in their community by name, make informed decisions on how to allocate limited housing resources, and rapidly gain insights on which strategies or interventions would be the most effective.
Powered by the Tableau Foundation, industry-leading data analytics software lets Built for Zero communities track their progress on a user-friendly platform. This way, leaders can quickly spot what is and isn’t working, and employ quality improvement practices to build and test new strategies — driving measurable outcomes toward achieving and sustaining an end to homelessness that leaves no one behind.
“One of our big interests is how can we help spread that value that we’ve discovered (…) to make it easy for people to get their hands on the data and to understand it, so that they know how to better solve the problems they’re trying to solve,” Darais said.
In Denver, they touched base with leaders testing a new tool to enhance the collaboration so crucial to accelerating the path to ending homelessness: Tableau Server, hosted on the Amazon Web Services cloud. This tool enables leaders to connect to dis-aggregated local data and publish granular visuals in a secure, private environment where they can create flexible and customized tools with ownership over access and permissioning, and learn from progress in other communities to drive improvements locally.
The accessibility of self-service analytics lets leaders on the frontlines of ending homelessness own and leverage their data, empowering decision-making and quality improvement as they move the needle in their communities.
Their engagement didn’t stop there: members of the Tableau Service Corps worked with local Metro Denver Homeless Initiative’s Homeless Management Information Systems (HMIS) Data Analyst Matt Richard and his team to set up powerful data visualizations, in order to help them understand and drive improvement around the community-level work to end homelessness. While the Denver team has been making strides toward the shared goal to reduce and end homelessness, they strive to be able to leverage the data to tell that story, inform their approach to address gaps in services and resources, and make the data accessible to share across homeless services agencies.
USING DATA TO END HOMELESSNESS
Innovative ways to leverage data are key to maximizing impact. In focus groups with communities, the team learned about the shared opportunities communities gain by viewing and comparing dashboards from other cities doing the same work. Sharing effective data visualizations with other agencies and stakeholders aids the collaborative problem-solving critical to aligning regional efforts to end chronic or veteran homelessness.
“I learned about the limited resources and time that folks have, and just how important it is to find efficiencies anywhere we can…folks need help finding those spots,” said Makabenta on the unique data challenges communities fighting homelessness face. Employing a data-driven approach can allow leaders to identify those critical areas to course-correct and connect people experiencing homelessness with the right interventions.
Local leaders can feed data into systems, but also should be able to reap the rewards of these efforts. Additionally, repackaging the data and insights to aid problem-solving with a variety of stakeholder groups is key — that’s where Tableau’s data visualizations can be leveraged.
“We can drive change in terms of improving performance for projects, by showing what the performance is and looks like,” mentioned Richard, on making the community’s progress toward Functional Zero accessible to partners and other organizations working toward the same objective. Accessing and analyzing a community’s real-time progress is essential to making the shared goal — to reach and sustain Functional Zero on homelessness — measurable and attainable.
We’re excited about the innovation and possibilities as the Tableau Foundation empowers over 80 Built for Zero communities to help solve one of the world’s most pressing issues, homelessness, using data.
Learn more about how we’re working with Tableau Software and Amazon Web Services to achieve a lasting end to homelessness that leaves no one behind:
Check out blog posts from our Tableau Service Corps volunteers on their experience working with the Metro Denver Homeless Initiative:


